(March 23, 2009 01:39 AKDT)
An animation of the lightning sequence:
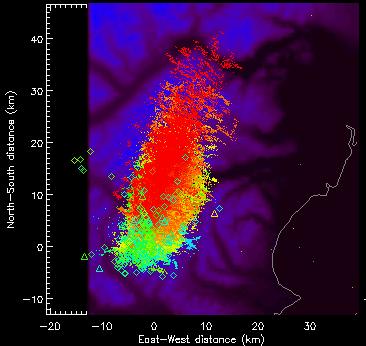
During this explosion, the electrical activity begins over the volcano,
coincident with the onset of the the explosion.
The activity persists for about 40 minutes; during this time the lightning migrates about 40
km NNE of Redoubt.
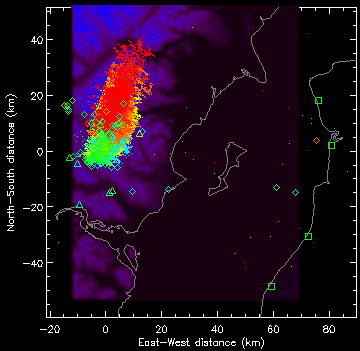
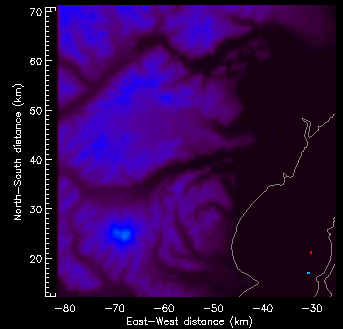
Right plot:
This plot is presented here to show the location of Redoubt relative to the electrical activity.
This plot has the same scale as the middle plot. Redoubt is the small and isolated blue feature
in the lower left corner.
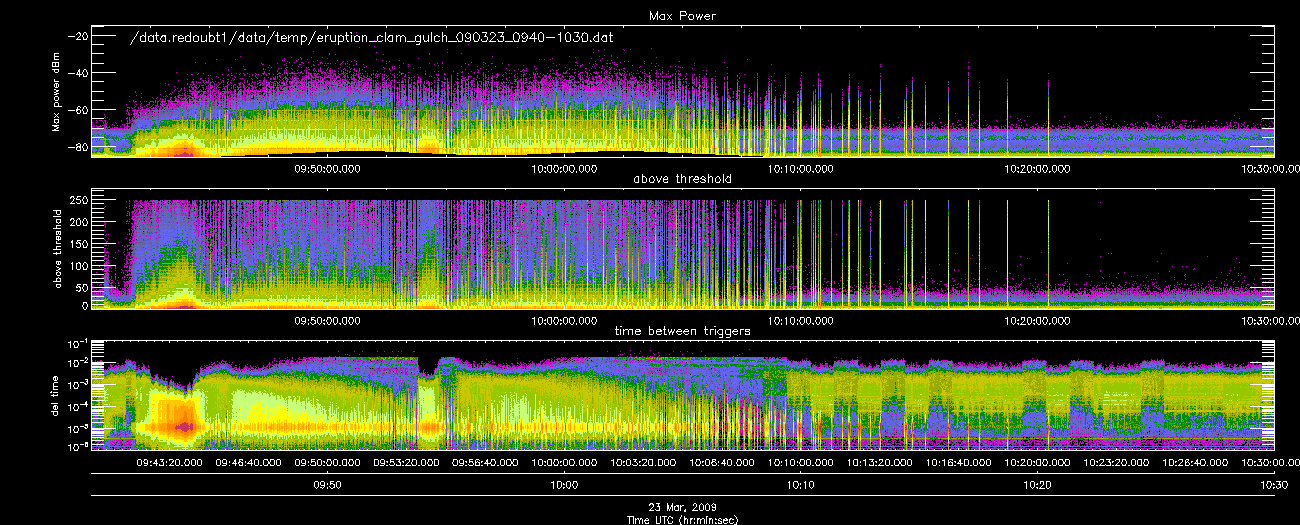
Bottom plot:
This plot shows the animation of the lightning sequence.
| Time of Event (AKDT) | Time of Event (UTC) | Plume Height (km) |
Lightning Duration (min) |
LMA Animation? |
|---|---|---|---|---|
| March 22, 2009 10:38 PM | March 23, 2009 06:38 | 8.6 | 2.4 | yes |
| March 22, 2009 11:02 PM | March 23, 2009 07:02 | 15.2 | 20.6 | yes |
| March 23, 2009 12:14 AM | March 23, 2009 08:14 | 15.2 | 29.9 | yes |
| March 23, 2009 01:39 AM | March 23, 2009 09:39 | 12.1 | 39.1 | yes |
| March 23, 2009 04:31 AM | March 23, 2009 12:31 | 18.3 | 53.4 | yes |
| March 23, 2009 07:41 PM | March 24, 2009 03:41 | 17.1 | no | |
| March 23, 2009 08:40 PM | March 24, 2009 04:40 | no | ||
| March 26, 2009 08:34 AM | March 26, 2009 16:30 | 9.1 | 2 | yes |
| March 26, 2009 09:24 AM | March 26, 2009 17:24 | 18.3 | 34.4 | yes |
| March 26, 2009 11:48 PM | March 27, 2009 07:48 | 39.9 | yes | |
| March 27, 2009 08:39 AM | March 27, 2009 16:39 | 15.2 | no | |
| March 27, 2009 05:35 PM | March 28, 2009 01:35 | 12.2 | 30.3 | yes |
| March 27, 2009 07:20 PM | March 28, 2009 03:20 | 15.5 | 34.8 | yes |
| March 27, 2009 11:20 PM | March 28, 2009 07:20 | 12.2 | 41.1 | yes |
| March 28, 2009 01:20 AM | March 28, 2009 09:20 | 15.2 | 42.8 | yes |
| March 28, 2009 03:29 PM | March 28, 2009 23:29 | 12.2 | 40 | yes |
| March 28, 2009 07:23 PM | March 29, 2009 03:23 | 13.7 | 23.2 | yes |
| March 29, 2009 11:20 AM | March 29, 2009 19:20 | 7.9 | yes | |
| March 29, 2009 11:10 PM | March 30, 2009 07:10 | 4.4 | yes | |
| March 30, 2009 10:50 AM | March 30, 2009 18:50 | 0.2 (sec) | yes | |
| March 30, 2009 11:30 PM | March 31, 2009 07:30 | 6.2 | yes | |
| March 31, 2009 04:07 PM | April 1, 2009 00:07 | 4.6 | 8.5 | yes |
| April 4, 2009 05:58 AM | April 4, 2009 13:58 | 15.2 | 69.8 | yes |